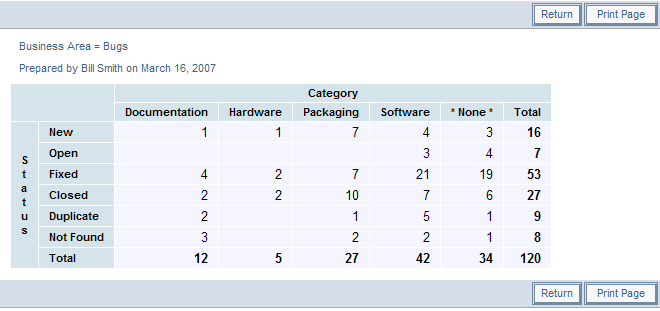
Matrix Reports can be built to display information in a tabular form. Using Matrix Reports, project or area managers can have a snapshot, at any time, of the values associated with any two fields in their database. The user can also drill down from matrix reports to obtain more detailed results.
To Prepare and run a Matrix Report
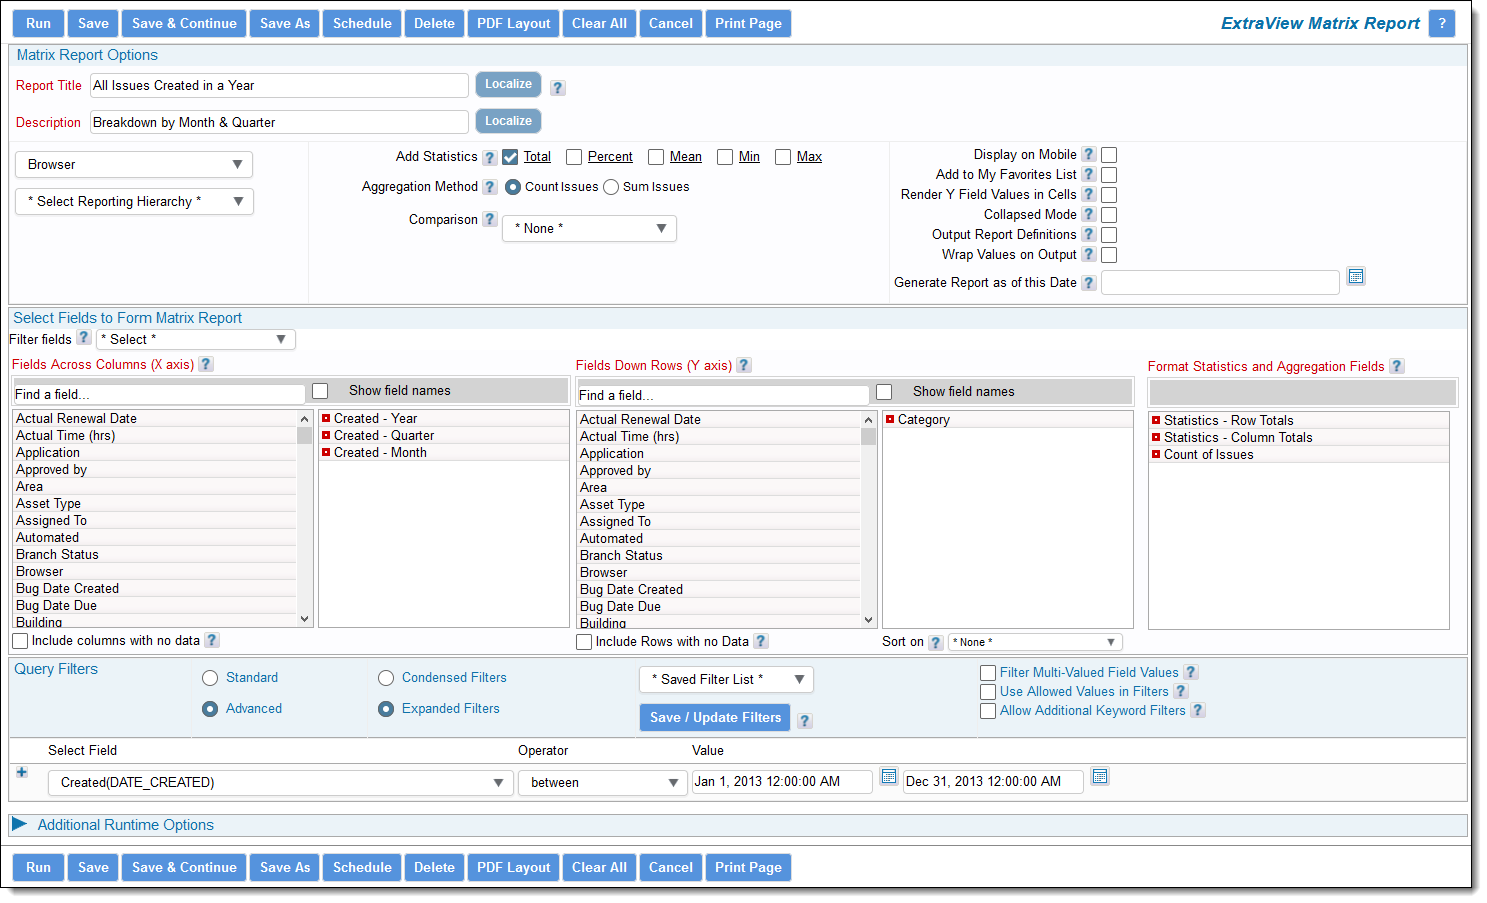
- From the Reports screen, select the option to Create New Matrix Report button and press the Go button, to establish the criteria for your search
- Enter a Report title and a Description in the fields provided
- Select the two fields to tabulate, by choosing one for the X-axis and one for the Y-axis. Note that you may include or exclude rows and columns that do not contain data with the two checkboxes to the right of the field selection lists
- Note the prompt Aggregation Method. You can either display a count of issues, or if you choose an Aggregation Method of Sum Issues, you then nominate a numeric type field and will sum the values within the field on the report output
- Select any report filters from the query filters section
- Click the Run Report button or Save button as needed.
Matrix Reports have many other options. Briefly these are:
- A variety of statistics can be added to the output - Total, Min, Max, Mean, Percentage
- On date fields, you can select to summarize by a variety of date groupings, such as by year and month
- You may add saved filters into the existing filters
- You can output the definition of the report. This will be displayed below the matrix report
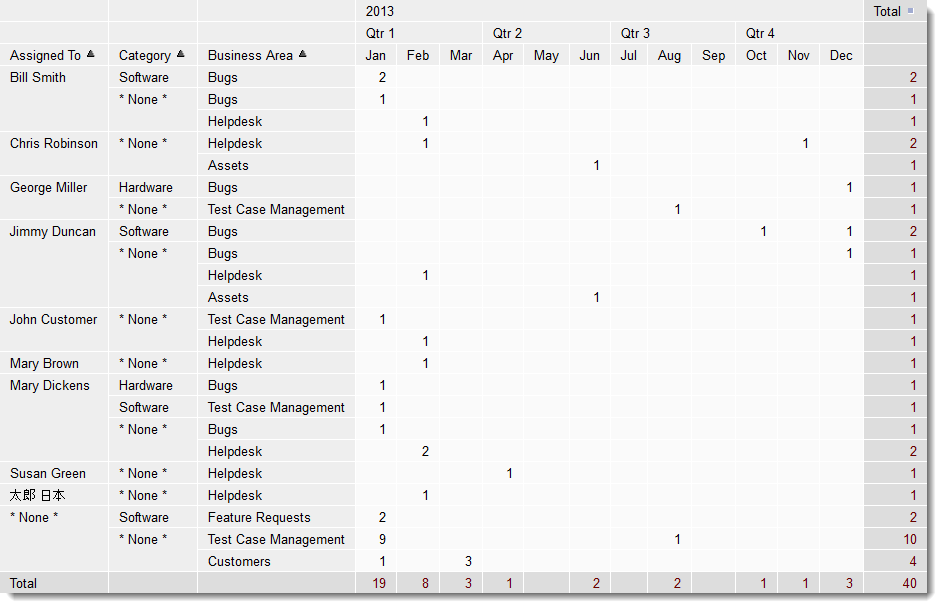
- You can place the same date field on the X axis of a report more than once, and then elect to group each field by year, quarter, month or a variety of other periods. In this way you can produce a report which, for example, groups months within quarters, and the quarters within years
- You can then elect to display the results compared to a previous period.
- Point-in-Time Reports - If this option is available to you, then you may enter a date and time in the past. The report will be produced showing the data as it stood at that point-in-time. A useful date to enter is $$SYSDAY$$-1. Then the report will be produced as the data stood at the end of the previous day
Reference
Additional information: http://docs.extraview.com/extraview-21/end-user-guide/reporting/report-types/matrix-reports


