Geospatial Reports are designed to display maps based on geospatial information stored within issues. Each issue displayed has a latitude and longitude coordinate that provides this information. The coordinates are typically generated automatically by ExtraView and stored within the issue. The coordinates are generated using ExtraView's inbuilt feature or by using an address verification with geospatial lookup from an external source.
There are 3 types of map produced:
- Interactive heat map - these maps place a marker at each location of the issues. When you zoom out, the markers are consolidated into a count of the issues at that area; when you zoom in you can see results to the street level. Interactive heat maps can only be generated to your browser
- Shaded map - these take a region, at the County, State or Country level and map them with shades, according to the number of issues within the region. These maps are static and can be sent to your browser or to an Adobe PDF document
- Heat map - these place a single dot on a map at the location of the issue. These maps are static and can be sent to your browser or to an Adobe PDF document.
At this moment, ExtraView provides geospatial data for:
- Each Country in the world
- The States of the USA
- The Provinces of Canada
- The Counties within each State of the USA.
The Report Editor
The report editor allows the user to choose the map type they want to produce. Shown below is the screen for Shaded maps. Shaded maps and heat maps require the selection of the administrative levels for which you want to produce the map. For example, if you choose The World, then the map will show the administrative boundaries contained within there, in this case the Countries. Another example might be that you choose administrative boundaries down to the States of the USA. In this case the Counties within the state(s) chosen with the report filters will be displayed. There is no requirement to set the administrative boundaries with Interactive heat maps as you are able to zoom in and out on the results, from a street level to a view of the world.
Interactive heat maps
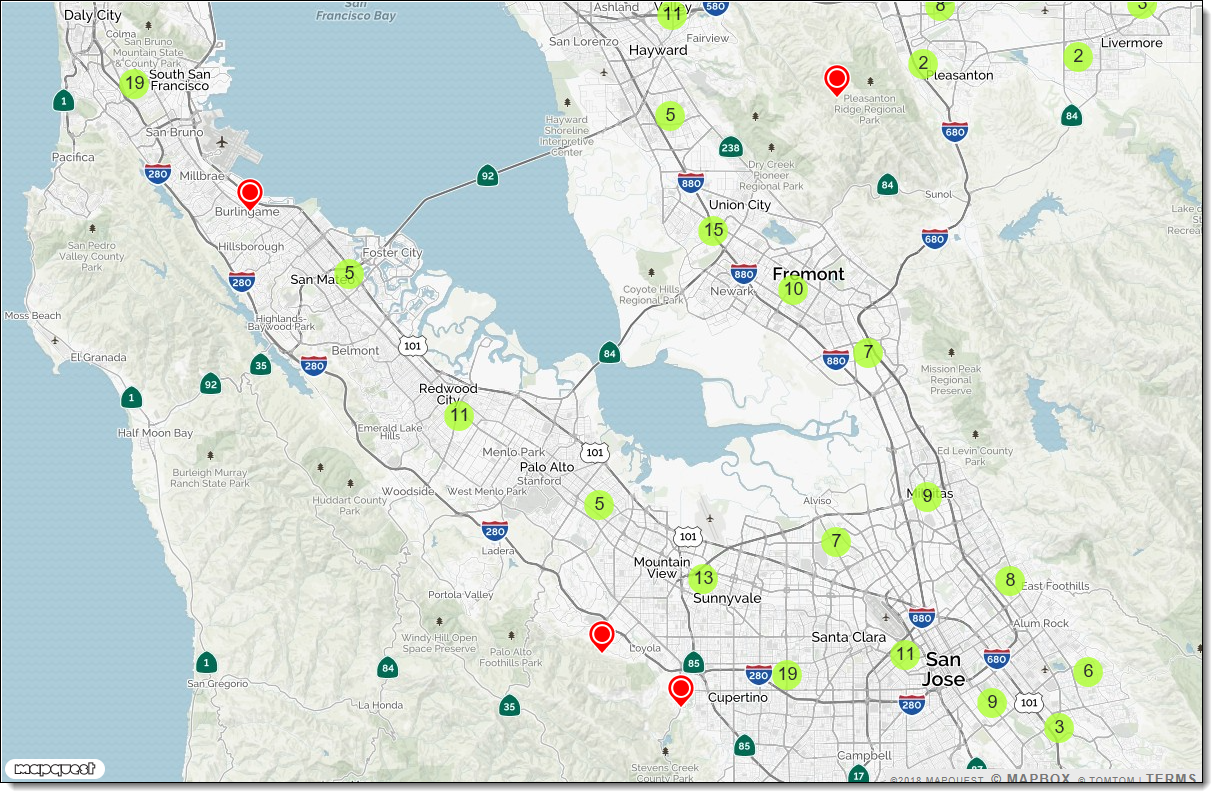
Following is a typical interactive heat map. The numbers with a green background represent the number of issues at that location. The red pointers are used when there is a single issue at a location. Holding your mouse over one of these will show more details, and you can click with your mouse on these to produce a Quicklist with the details of the issues at that location. You may zoom in and out using the thumb wheel of your mouse.
Shaded maps
The map below shows how shades of a color will provide an indication of how many issues exist within each boundary, in this case the Counties of the State of California. These maps are static and can be viewed within your browser, or used to produce a PDF report.
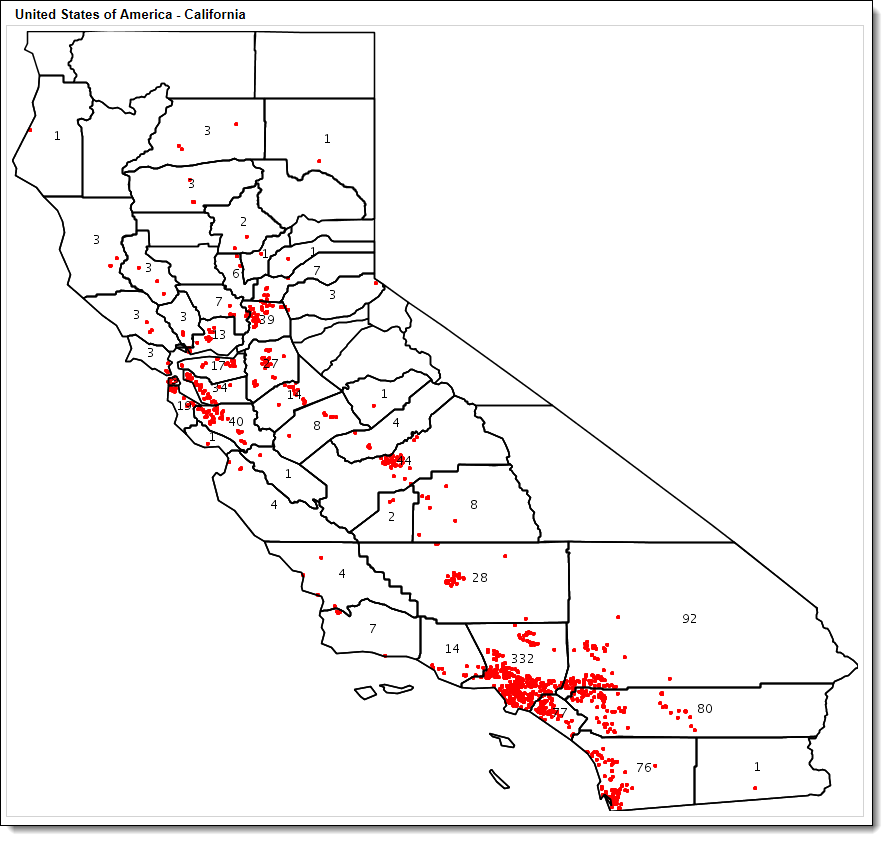
Heat Maps
The map below shows how a single colored dot is placed at the location of an issue, in this case within Counties of the State of California. These maps are static and can be viewed within your browser, or used to produce a PDF report.
Reference
Additional information: http://docs.extraview.com/extraview-21/end-user-guide/reporting/report-types/geospatial-reports