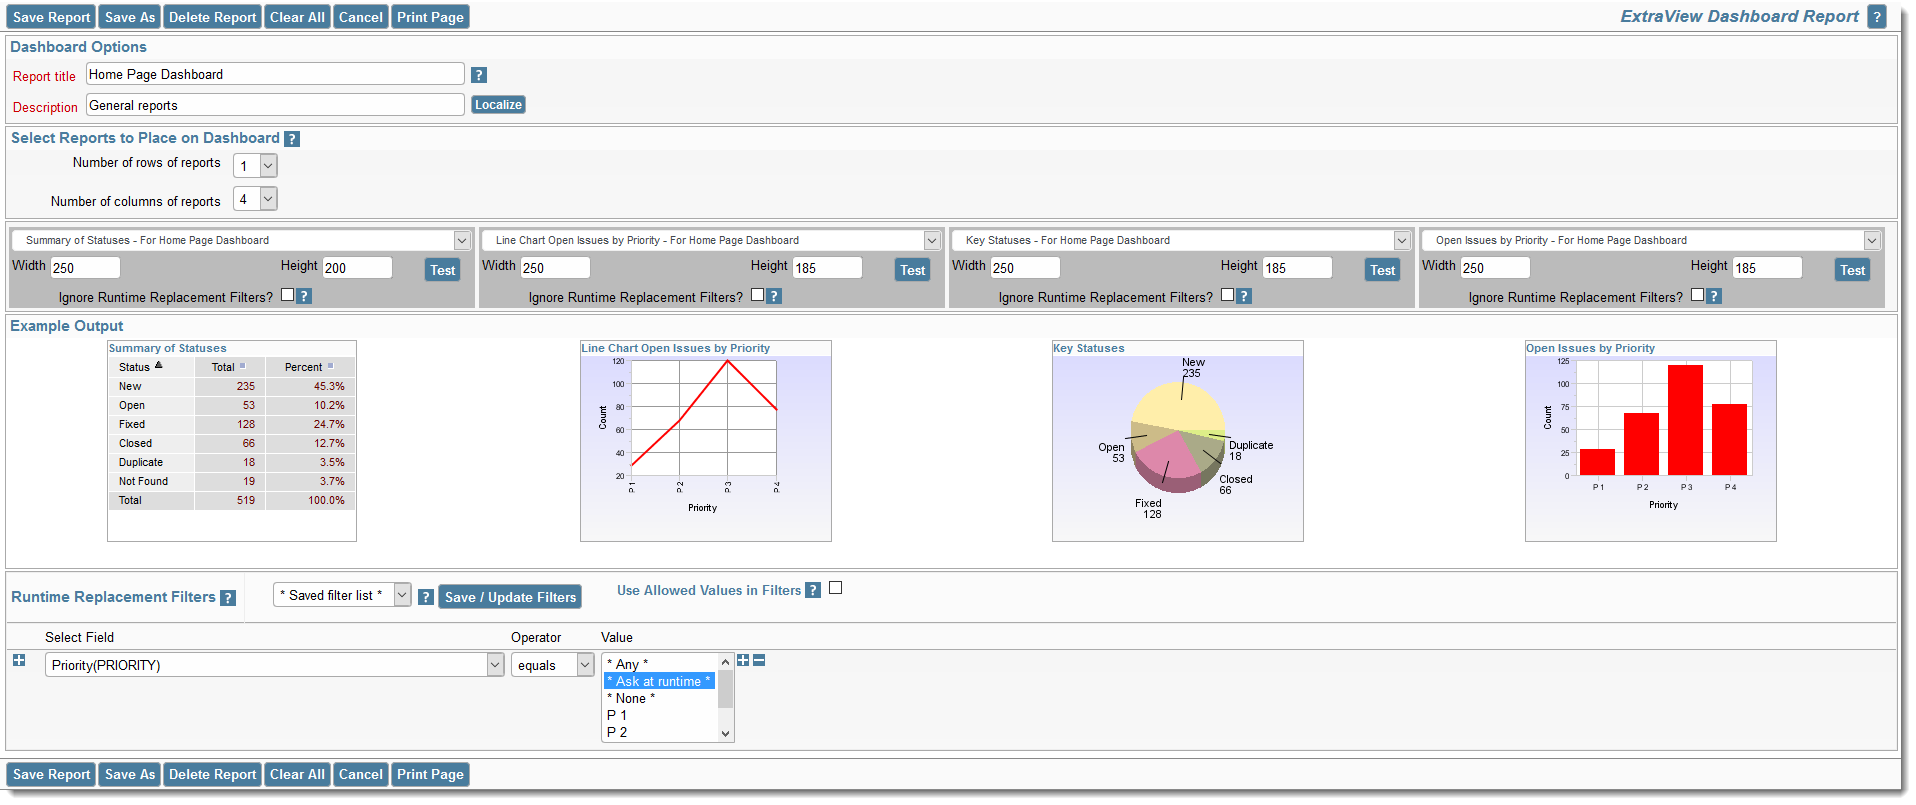
Dashboard reports are primarily used to create a container for several charts or reports that can be placed on user's Home Pages.
To create a dashboard report, you first create the individual reports and charts that you want to place on the dashboard. You can create a dashboard with up to 10 reports horizontally and 10 reports vertically.

When you create a new dashboard report you select how many rows and how many columns of reports you want to see, then select the reports you want to display. Note that you can only place matrix, summary, aging reports and charts within dashboards. You can select the size of the individual reports, in order to improve the appearance of your dashboard. You may also set runtime replacement filters on a dashboard report. In that case, the value of filters you set will replace the filters for the same fields in all the individual reports within the dashboard report.
Reference
Additional information: http://docs.extraview.com/extraview-21/end-user-guide/reporting/report-types/dashboard-reports


|